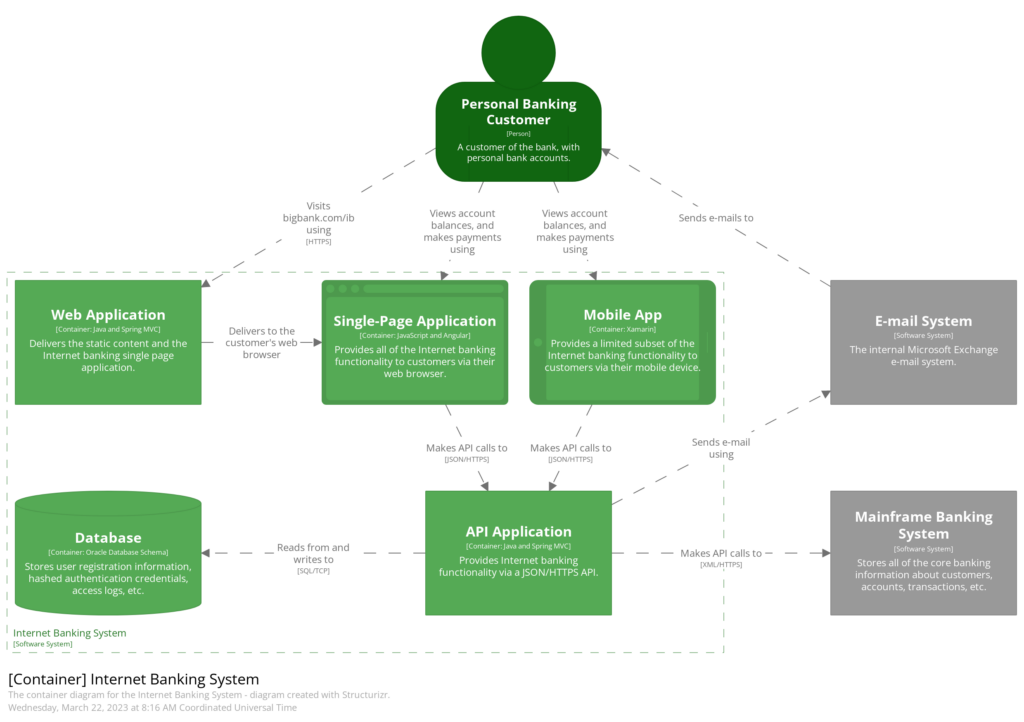
In the world of engineering, system design, and problem-solving, effective visualization is crucial. One powerful tool that aids in simplifying complex systems and processes is the block diagram. A block diagram is a graphical representation that breaks down a system into interconnected blocks or functional units. It provides a high-level overview of the system’s components and their relationships, making it easier to understand and analyze. In this article, we will explore what a block diagram is, its uses, importance, and provide a step-by-step guide on how to create a block diagram.
What Is a Block Diagram?
A block diagram is a visual representation that simplifies complex systems or processes by breaking them down into blocks or functional units. Each block represents a specific component or function, and the connections between blocks illustrate the flow of information or relationships between components. The blocks are typically labeled with descriptive names to identify their purpose within the system. Block diagrams are widely used in various fields, including engineering, system design, software development, and process analysis.
Uses of Block Diagrams:

Source: google.com
System Analysis and Design: Block diagrams are commonly used in system analysis and design. They provide a visual representation of a system’s components and how they interact with each other. By analyzing the block diagram, engineers and designers can identify inefficiencies, areas for improvement, and potential bottlenecks in the system. This information can then be used to optimize the system’s design and functionality.
Communication and Collaboration: Block diagrams are an effective communication tool, particularly when dealing with complex systems. They provide a visual representation that is easily understood by different stakeholders, regardless of their technical background. Block diagrams facilitate clear communication and collaboration among team members, allowing them to discuss and brainstorm ideas effectively.
Troubleshooting and Problem-Solving: When encountering issues or inefficiencies within a system, block diagrams can be instrumental in troubleshooting and problem-solving. By visually mapping out the system’s components and their relationships, engineers can identify the root causes of problems and develop targeted solutions. Block diagrams help isolate specific blocks or functions that may be causing issues, allowing for more efficient and effective problem resolution.
Documentation: Block diagrams serve as a concise form of documentation for complex systems or processes. They provide an overview of the system’s architecture, components, and relationships, making it easier to understand and maintain. Block diagrams can be included in technical documents, user manuals, or design specifications, ensuring that the system’s structure is well-documented and accessible to stakeholders.
The Importance of Block Diagrams:
Simplify Complexity: Complex systems can be challenging to understand and analyze. Block diagrams break down the system into manageable blocks, simplifying the complexity and providing a clear overview. This simplification allows engineers and designers to focus on specific components or functions, making it easier to analyze and optimize the system.
Enhance Understanding: Visual representations, such as block diagrams, enhance understanding by providing a clear visualization of a system’s components and relationships. It allows stakeholders to grasp the system’s structure, interactions, and dependencies more easily. This shared understanding promotes effective collaboration and decision-making among team members.
Identify System Interactions: Block diagrams highlight the interactions and dependencies between system components. By examining the connections between blocks, engineers can identify potential points of failure, areas for improvement, or bottlenecks in the system. This understanding enables them to make informed decisions and design robust systems.
Facilitate System Optimization: Block diagrams provide a holistic view of the system’s architecture and functionality, enabling engineers to identify areas for optimization. By analyzing the block diagram, they can make informed decisions on modifying or upgrading specific components or functions to improve the system’s overall performance.
How to Create a Block Diagram:

Source: google.com
Creating a block diagram involves several steps:
Define the System: Clearly define the system you want to represent with the block diagram. This could be a physical system, a software application, or a business process.
Identify the Components: Identify the key components or functional units of the system. These could be physical components, software modules, or specific processes within a larger system.
Determine Relationships: Determine the relationships between the components. Identify how the components interact with each other and the flow of information or signals between them.
Design the Blocks: Represent each component as a block or rectangle. Label each block with a descriptive name to indicate its function or purpose within the system.
Connect the Blocks: Draw lines or arrows to connect the blocks, representing the relationships or interactions between components. Use appropriate symbols or annotations to indicate the nature of the connection, such as data flow, control flow, or feedback loops.
Add Details: Provide additional details within the blocks or annotations to provide more information or context about each component.
Review and Refine: Review the block diagram for accuracy, completeness, and clarity. Seek feedback from team members or stakeholders to ensure that the representation accurately reflects the system.

Source: google.com
Block Diagram Tools and Software:
There are various tools and software available that can assist in creating block diagrams. These tools provide pre-built shapes, symbols, and templates, making it easier to create professional-looking diagrams. Block Diagram creation tools offer a user-friendly interface, drag-and-drop functionality, and customization options to create visually appealing block diagrams.
Block diagrams are powerful visual tools that simplify complex systems or processes by breaking them down into manageable blocks. They are widely used for system analysis, communication, problem-solving, and documentation. By utilizing block diagrams, engineers and designers can enhance understanding, identify system interactions, and optimize system performance. With the step-by-step guide and the use of block diagram tools and software, teams can effectively create informative and visually appealing block diagrams. So, embrace the power of block diagrams and leverage them to better analyze, communicate, and optimize your systems or processes.


