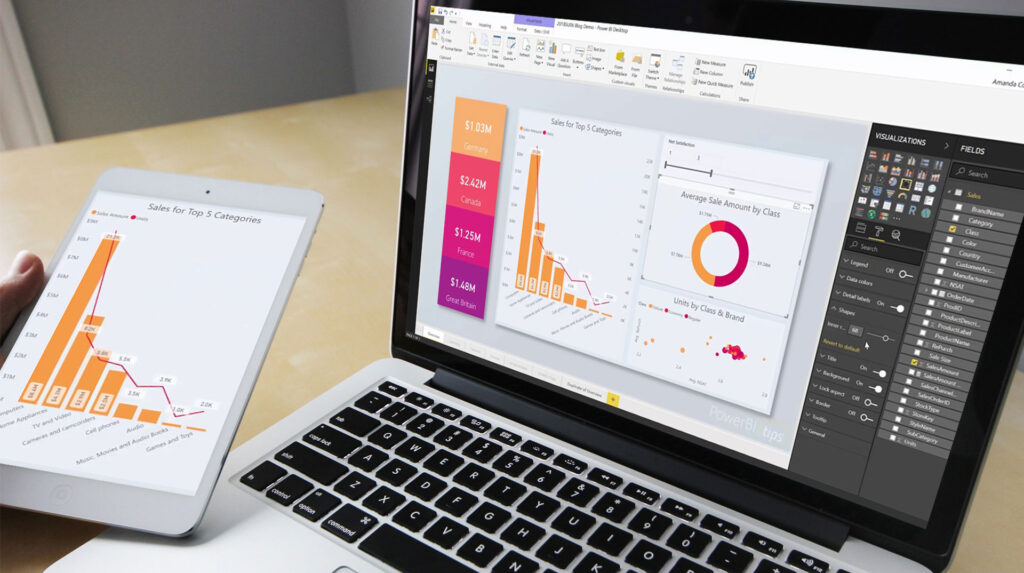
To make a good Power BI report, there are many things to keep in mind. These can include layout, icons, data visualizations, and more.
In this article, we will go over some of the most important aspects of creating a good Power BI report. These tips and tricks will help you avoid the common pitfalls.
By enrolling in a Power BI course, professionals can learn how to effectively leverage this powerful tool.
Financial Power BI examples
Power BI offers financial dashboards and reports that combine multiple data sources to show key metrics in an appealing visual format. This makes it a more intuitive tool for users to interact with.
There are many different Power BI examples to show you how the interactive reporting works. They range from FP&A and contract analysis to marketing and sales.
The FP&A sample, for example, combines financial and resource planning data into one report. This means that government agencies can quickly compare budgets to actual spending and allocate resources effectively.
It also uses dynamic KPI cards to indicate how users are positioned in the report. These cards change as users interact with the data, eliminating the need to click back and forth between tables to remember where they are in the report.
Healthcare Power BI examples

Source: pinterest.com
A wide range of healthcare organizations have embraced Power BI as a tool to help them get data insights that can improve their operations. They are able to visualize, monitor and share dashboards to make data-driven decisions in many areas of their business, including facility performance, revenue summary, departmental information, etc.
Moreover, this platform allows healthcare workers to analyze patient data and collaborate with others to get a comprehensive picture and provide critical care promptly. This can be a valuable asset in an emergency, especially if healthcare workers have access to a powerful data analytics and reporting platform like Power BI.
Using these reports, they can easily identify potential issues such as surgeons spending too much time in the operating room for certain surgeries or patients failing to recover from surgery as expected. They can also evaluate surgeons’ performance based on their average age, the surgeries they performed, and the number of planned versus emergency surgeries.
Education Power BI examples
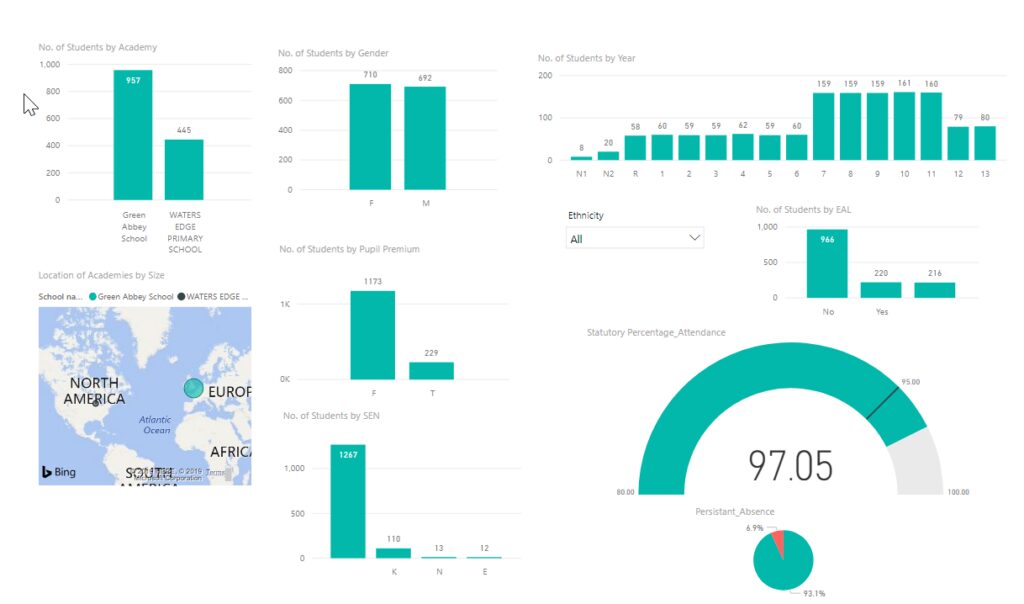
In the educational sector, it is crucial to get all the relevant information in front of the users so that they can make informed decisions. This can be done through the use of dashboards and reports.
Power BI interactive reporting lets you explore data in different ways to help you understand your key performance indicators (KPIs) better. For example, you can see if your school’s retention rate is dropping by year group or class level.
You can also drill down into any data point to find out more about specific students. For example, if you spot a spike in behavior incidents, selecting a particular student will show you which year group or subject they are from.
Using data analytics and business intelligence solutions, you can get the right information in front of you without any hassle. For example, you can get detailed reports on student records such as invoices, medical history, academic progress, and so on.

Source: pinterest.com
Manufacturing Power BI examples
Power BI interactive reporting offers a range of visualization options and is a great way to share information with your team. The first step is to figure out what data you need to see, and then choose a professional agency, which will best highlight it https://cobit-solutions.com/en/4-osnovnyh-otcheta-dlja-biznesa-v-power-bi-2/
Dashboards can come from many reports or underlying datasets, and they represent a consolidated view of important business metrics.
Creating a dashboard is not a simple process that requires knowledge of Power BI and SQL. Once you have a data demand, you can use this visualization to get the answers in graphs, bar charts, pie charts, and number sets.
Power BI can be used to analyze data for a variety of purposes, from marketing to sales and finance. These Power BI examples are helpful for executives, managers, and digital marketers to gain insights that help them improve business operations and performance.


